The Difference Between HCP Specialty and Clinical Focus in Commercial Targeting
On this page
A heart failure brand pulls cardiologists, a knee implant company pulls orthopedic surgeons, and the resulting list looks sound because every name on it carries the right label.
The weaknesses surface later, in the field. Some of those cardiologists spend most of their week on imaging and rarely manage heart failure patients, while some providers who do manage those patients never appear on the list because their specialty label points somewhere else.
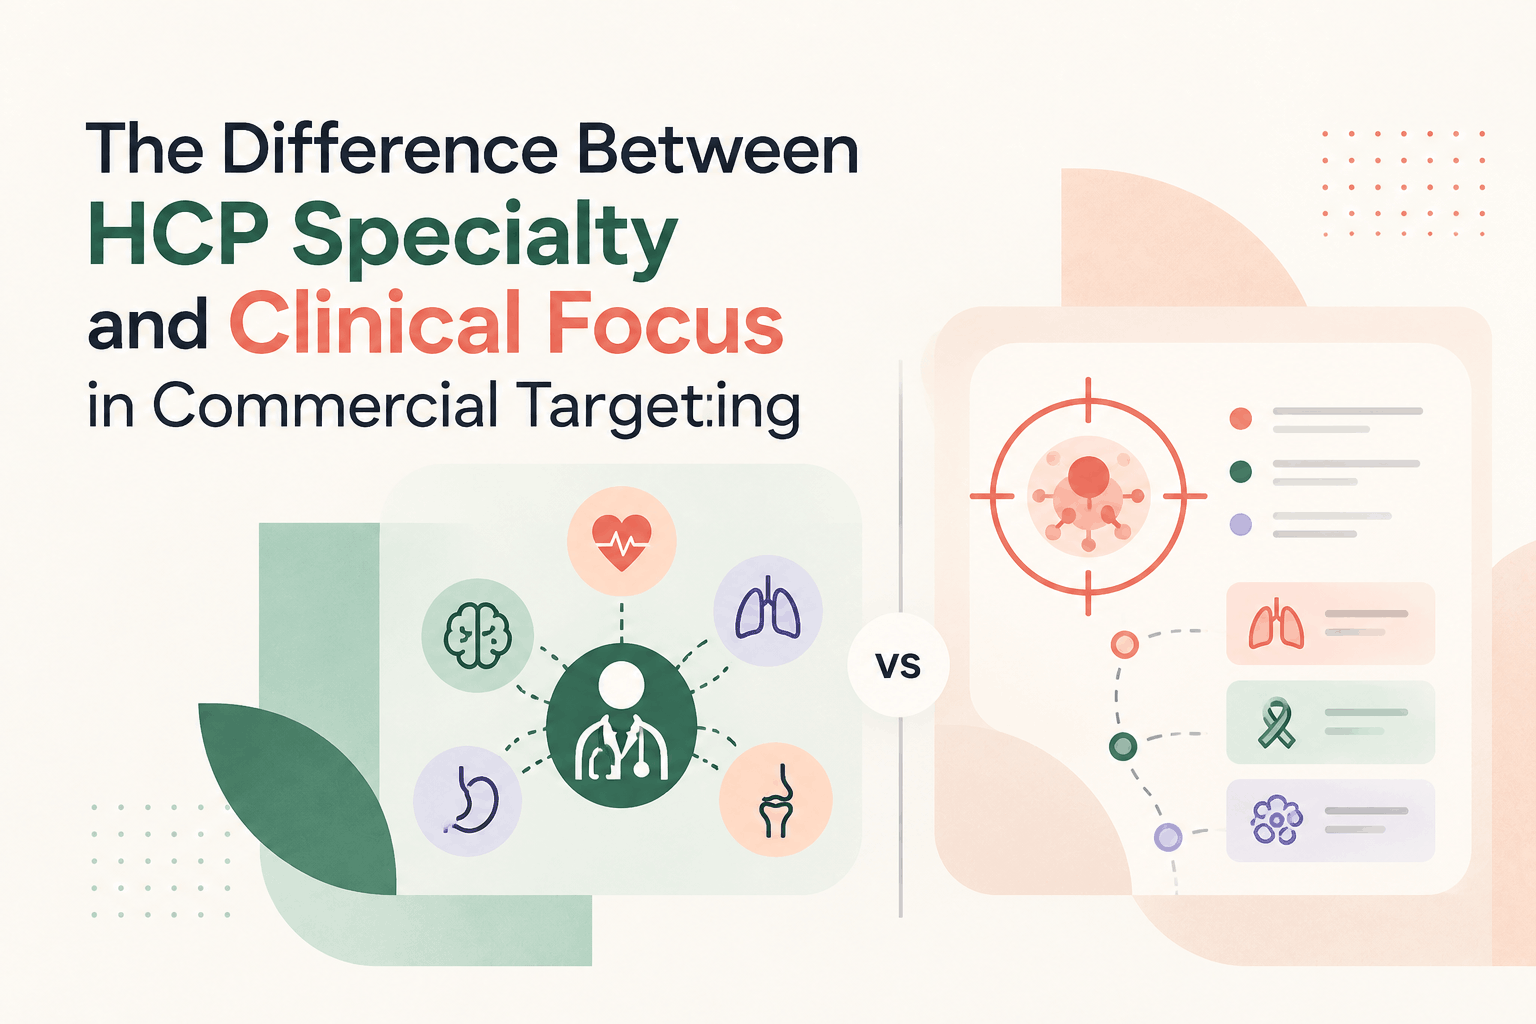
HCP specialty describes what a provider trained and was certified to do. Clinical focus describes what that provider does now, for which patients, and at what volume. The two overlap often enough that commercial teams treat them as interchangeable, and they diverge often enough that the difference shows up directly in rep productivity and market sizing.
The gap is also measurable. Specialty labels in the federal provider registry are self-reported and largely unverified, and board certification records training that practice tends to narrow over time.
For pharma HCP targeting and MedTech field strategy alike, using specialty as the starting filter and clinical focus as the qualifying layer produces lists that hold up once reps start calling.
Why HCP Specialty Alone May Not Define Clinical Relevance
Specialty is the one attribute every NPI record is guaranteed to carry, because an NPI application must include a taxonomy code describing the provider’s classification and specialization, with one code designated as primary. That universal coverage makes it the natural first filter in a segmentation model.
The label still deserves scrutiny, because its reliability depends on how it was created and how far a provider’s practice has moved since it was assigned.
Specialty Data Sets the Outer Boundary of a Target Universe
HCP specialty data tells commercial teams which providers could plausibly be relevant. A provider without the training to perform a procedure or manage a condition is rarely a viable target, so specialty works well as an exclusion filter. It also shapes messaging, since a cardiologist and a family physician expect different depth of clinical evidence, and it supports compliance reviews that check whether promotion is reaching appropriate audiences.
The structure behind the label is substantial. The American Board of Medical Specialties reports 997,864 physicians and medical specialists actively certified by its member boards, across 38 specialties and 89 subspecialties. Those credentials feed the Health Care Provider Taxonomy code set maintained by the National Uniform Claim Committee (NUCC), which sorts providers into three levels running from a broad provider grouping to a classification and then an area of specialization.
For physicians, the classification level generally corresponds to board certification and the area of specialization to subspecialty certification, as researchers at Virginia Commonwealth University explain in their claims-based study of the state’s physician workforce.
Specialty data handles that structural question well. It was never designed to describe how a provider spends clinical time, and the organizations that maintain it say as much.
Taxonomy Codes Are Self-Selected and Rarely Revisited
NUCC states that taxonomy codes are self-selected by providers and define an area of specialty, and it explicitly separates them from the services a provider renders. Choosing a code is a business decision each provider makes based on education and training.
So the code reflects how a provider chose to describe themselves at the time of enrollment, which may or may not match their current caseload.
The federal registry adds little verification on top of that choice. CMS guidance to state Medicaid programs notes that NPPES does not verify the accuracy of taxonomy codes and does not monitor changes in a provider’s specialization over time, leaving every update to the provider.
The same guidance acknowledges that one provider can legitimately hold several taxonomies, using a hand surgeon classified under both orthopedics and plastic surgery as its example. In practice, a surgeon who completed a fellowship years ago may still carry a general code, and nothing in the system prompts a correction.
Accuracy problems concentrate at the level commercial teams care about most.
In a study comparing NPPES taxonomy codes against departmental listings for orthopedic and general surgeons at three academic institutions, 99% had selected the correct general specialty, but only 64% had chosen an appropriate subspecialty.
Put differently, the registry reliably separates surgeons from internists and becomes far less dependable when the question is which surgeons concentrate on spine, trauma, or joints.
Board Certification Records Training, and Practice Narrows After It
Even accurate specialty data describes a point in time. Physicians concentrate their work as careers progress, and the certifying bodies acknowledge it.
ABMS approved a focused practice designation in March 2017 to recognize diplomates who concentrate on specific patient populations, conditions, or procedures after initial certification, and it describes these areas as narrower than a subspecialty. The board’s own example is an emergency physician who earns a designation in advanced emergency medicine ultrasonography.
The divergence is widest among generalists. Using Virginia’s all-payer claims database, the VCU researchers found that in 2019 nearly 20% of internists, 54% of pediatricians, and 66% of obstetrician-gynecologists met their claims-based definition of providing primary care.
A national analysis of Medicare fee-for-service claims took a similar activity-based approach and found that between 61% and 68% of family medicine and internal medicine physicians with at least 50 Medicare beneficiaries were providing primary care.
The same study estimated that only 40% to 45% of nurse practitioners meeting its panel threshold were primary care providers. A large share of clinicians carrying a generalist label, in other words, practice in ways that label does not describe.
For a commercial team, that variation is the central issue. A primary care launch that targets every internist reaches a population in which most providers may not deliver primary care at all, at least by the measure the Virginia study used.
What Clinical Focus Adds to an HCP Profile
Physician clinical focus is the observed pattern of a provider’s work, assembled from what they bill, which patients they manage, what they publish and investigate, and where they practice. No single data source captures all of it, so a usable profile layers several signals and reads them against the specialty label.
Agreement confirms the label, and disagreement tends to be the more valuable finding because it points to providers whose relevance the label hides or overstates.
Procedures and Diagnoses Show Which Patients a Provider Actually Manages
Procedure codes (CPT and HCPCS Level II) record the services a provider bills, and ICD-10-CM diagnosis codes record the conditions attached to those services. Together they turn a specialty label into a measurable caseload.
Two cardiologists with identical taxonomy codes can look entirely different once their billing shows one performing high volumes of catheter-based interventions and the other managing outpatient heart failure.
The diagnosis layer surfaces providers the specialty layer misses entirely. A 2026 study of Montana Medicaid claims noted that nurse practitioners and physician associates provide specialty care their taxonomy codes do not reflect, and found that a high proportion of visits associated with a type 1 diabetes diagnosis reliably identified those specializing in endocrinology.
The national Medicare workforce analysis applied related logic at scale, measuring how widely each clinician’s diagnoses spread across ICD-10 chapters and how often they billed procedures atypical for primary care.
Claims have limits worth stating plainly. They capture billed activity within the payors a dataset covers, and they show what a provider did, which is a separate matter from what that provider prefers or plans to do next. Investigational therapies also generate no billing until they reach the market, so claims alone will understate focus in emerging areas.
Publications and Clinical Trials Show Where Peers Recognize a Provider’s Expertise
Billing records volume, while research activity indicates where peers recognize a provider’s expertise and where that expertise is heading.
A provider whose recent papers concentrate on a single condition, or who serves as a site investigator on trials for a new therapy class, is signaling a focus that claims may not yet reflect. Trial participation is especially telling for therapies that have not launched, because it shows which providers already have hands-on experience with the mechanism.
These signals carry their own skew. Publication and trial records favor academic physicians, so a high-volume community proceduralist can look invisible on this layer while dominating the claims layer. Effective KOL identification therefore reads research influence and clinical volume together, since each covers the other’s blind spot.
Affiliations and Industry Relationships Place a Provider in Context
Affiliations connect an individual provider to the hospitals, groups, and sites of care where product decisions are made.
A surgeon’s clinical focus matters less if the facility where they operate has standardized on a competing device, and a prescriber’s reach extends further when they anchor a referral-heavy group practice.
Hence affiliation data often decides whether a clinically relevant provider is also a commercially reachable one.
Industry relationships add a different kind of evidence. Open Payments, the federal disclosure program for manufacturer payments to clinicians, published 17.07 million records totaling $14.67 billion in payments and other transfers of value for program year 2025. Consulting, speaking, and research payments tied to a specific therapeutic area show where manufacturers already engage a provider, which is a reasonable proxy for perceived focus.
CMS itself notes that the data is open to individual interpretation, so payment history works best as context alongside clinical activity.
When Clinical Focus Matters for Pharma and MedTech Commercial Research
Specialty alone is sometimes enough. A broadly indicated primary care product, or a supply item every provider in a specialty uses, can be targeted reasonably well by label. Clinical focus earns the added analysis when relevance depends on a specific patient population, a specific procedure, or an accurate count of how many providers actually qualify.
Narrow Indications Require Diagnosis-Level Pharma HCP Targeting
Pharma HCP targeting for a narrowly indicated therapy runs into the specialty problem quickly.
A rheumatology label can include providers whose panels lean toward osteoarthritis and gout alongside providers with large inflammatory arthritis populations, and only the second group matters for a biologic indicated in a specific autoimmune disease. Diagnosis volume separates the two groups, while a specialty filter treats them as a single audience.
Prescriber populations also extend beyond physicians. The Montana research shows that advanced practice clinicians can carry substantial specialty caseloads under generic taxonomy codes.
A target list built on physician specialty data alone misses them, along with whatever influence they exert on prescribing inside specialty practices. Worth noting, these clinicians are often more accessible to field teams than the physicians they work alongside.
Device Adoption Depends on Procedure Fit
MedTech commercial teams sell into procedures, which makes procedure volume the most direct proxy for relevance.
The surgeon taxonomy study shows the risk of relying on labels here, since roughly a third of surgeons at three academic centers had not selected an appropriate subspecialty code. A spine device company filtering by subspecialty taxonomy would both miss qualified surgeons and include others who rarely perform the target procedure.
Procedure-adjacent targeting extends the same logic. Surgeons already billing for the procedure a new device improves or replaces are the most credible early adopters, whatever their taxonomy code says.
Site of care matters as well, since a high-volume surgeon operating mainly in an ambulatory surgery center presents a different purchasing path from one operating in a hospital with a value analysis committee.
Market Sizing Built on Specialty Headcounts Overstates Opportunity
HCP data analysis for market sizing inherits every weakness of the specialty label. If a team sizes a primary care opportunity by counting every internist, the Virginia findings suggest the count could overstate the relevant population several times over.
The same distortion carries into investor materials, territory staffing models, and forecast assumptions, each of which compounds an inflated denominator. Sizing on observed clinical activity produces a smaller number that is far easier to defend.
The error also runs in the other direction. When a meaningful share of the target patients are managed by providers outside the expected specialty, such as advanced practice clinicians or physicians in adjacent fields, a specialty-based count understates the reachable audience in some regions and overstates it in others.
Territory designs built on those counts end up assigning reps where label density is high and patient density is not.
Medical Affairs Needs to Separate Active Experts From Credentialed Ones
Medical affairs teams face a version of the same issue when mapping thought leaders. Board certification and academic title identify credentialed experts, while advisory boards and educational programs need providers who are actively treating the relevant patients and contributing to the current evidence base.
Combining claims volume with publication and trial activity helps teams build an HCP engagement plan around providers whose clinical focus matches the program’s purpose.
How Alpha Sophia Helps Commercial Teams Understand HCP Specialty and Clinical Activity
Alpha Sophia is an NPI-anchored reference layer covering more than 4 million US providers, with clinical activity drawn from all-payor medical claims spanning Medicare, Medicaid, and commercial payors.
Specialty and clinical activity sit on the same provider profile, so teams can filter by one and qualify by the other without stitching separate sources together.
Specialty and Taxonomy Filters Set the Initial Universe
The platform carries provider taxonomy and specialty classifications from broad groupings down to precise subspecialties, which gives teams the structural boundary described earlier. A MedTech team can start with orthopedic surgery, or narrow to a specific subspecialty, and see the resulting provider count before committing to a campaign or territory design.
Procedure and Diagnosis Filters Test Whether the Label Holds
From that starting universe, teams filter by CPT and HCPCS Level II procedure codes and by ICD-10 diagnosis codes or broader CCSR categories, then rank providers by volume. Individual ICD-10 codes let teams target the exact clinical scenario an indication or device addresses, while CCSR categories suit broader therapeutic-area views.
Teams can also start from clinical activity and work backward, which surfaces nurse practitioners, physician assistants, and physicians with unexpected labels who manage the target population.
Cohort analysis then supports comparing segments, such as high-volume and low-volume providers within the same specialty.
Research, Payments, and Affiliations Complete the Profile
Provider profiles also carry publications, clinical trial activity, open payments history, education, and affiliations with health systems, groups, and sites of care.
KOL AI draws on publication and clinical trial activity to support key opinion leader identification, so medical affairs and marketing teams can see influence and clinical volume side by side. Pharma teams qualifying prescribers can add prescribing behavior to the same view.
Teams Can Query the Same Data From Their Own Tools
The in-app Assistant converts plain-English questions into filtered provider lists and shows the filters it applied, so a team can check the logic behind any answer.
Teams that already work in Claude, ChatGPT, or Cursor can connect those tools to Alpha Sophia through the Model Context Protocol (MCP), and autonomous workflows can run multi-step tasks such as sizing an audience and building a target list.
Results export to Excel or CSV, sync natively with HubSpot and other systems through export or the open API. In each case Alpha Sophia supplies the reference data, and the team’s own systems handle what happens next.
Conclusion
Specialty and clinical focus answer different questions, and commercial targeting needs both. HCP specialty defines who could be relevant, based on training and certification. Clinical focus establishes who is relevant now, based on the procedures providers perform, the patients they manage, and the research and relationships around their practice.
The evidence on taxonomy accuracy and generalist practice patterns shows how far the two can drift apart, particularly at the subspecialty level and within broad specialties like internal medicine.
For pharma and MedTech teams, the practical change is one of sequencing. Specialty sets the outer boundary, and clinical activity qualifies, ranks, and sometimes expands the list. Teams that build HCP segmentation this way spend less field time on providers who only look right on paper.
To see how specialty and clinical activity combine for a specific therapeutic area, book a demo with Alpha Sophia.
FAQs
What is HCP specialty data?
HCP specialty data describes a provider’s area of training and certification, usually recorded through taxonomy codes in the NPI registry and through board certification. It classifies providers from broad groupings down to subspecialties such as interventional cardiology. Because providers self-select taxonomy codes, the data is most reliable at the general specialty level.
What is the difference between HCP specialty and clinical focus?
HCP specialty reflects what a provider trained and was certified to do. Clinical focus reflects what the provider does in practice, measured through the procedures they bill, the diagnoses they manage, and their research activity. Two providers with the same specialty can have very different clinical focus.
Why is clinical focus important in HCP targeting?
Specialty filters alone include providers who rarely treat the target patients and exclude others who do. Clinical focus narrows HCP targeting to providers whose actual caseload matches the indication or procedure, which improves rep productivity and the accuracy of market sizing.
How can pharma teams identify an HCP’s clinical focus?
Pharma teams typically start with diagnosis volumes tied to the indication, then add procedure data, prescribing patterns, publications, and clinical trial involvement. Reviewing nurse practitioners and physician assistants alongside physicians also matters, since their specialty work is often missing from taxonomy codes.
What data can help determine physician clinical focus?
The most useful sources are procedure codes, ICD-10 diagnosis codes, publications, clinical trial participation, organizational affiliations, and Open Payments records. Each signal has gaps, so combining them gives a more reliable picture than any single source.
How does Alpha Sophia help analyze HCP specialty and clinical activity?
Alpha Sophia places specialty and taxonomy data on the same profile as all-payor procedure and diagnosis volumes, publications, clinical trials, affiliations, and open payments for more than 4 million providers. Teams can filter by specialty, qualify by clinical activity, and query the data through the platform, their own AI tools via MCP, or the API.
