Why Healthcare Field Sales Coverage Breaks Without Continuous Territory Updates
On this page
Most healthcare field sales teams treat territory design as a one-time event tied to the annual planning cycle. The pattern is well-documented.
According to SMA and Xactly research spanning more than 100 sales organizations, 83% of companies still rely on manual processes either moderately or frequently when designing territories, and a separate Sales Management Association survey via Anaplan found that about 53% of organizations are late completing their annual sales planning cycle.
The plan goes live in Q1, picks up minor edits during a mid-year review, and then sits unchanged until next year’s process begins.
The underlying market does not follow that same sequence. Providers move between practices, get acquired by hospital systems, shift volume into ambulatory surgery centers, and stop billing for some procedures while ramping up others.
By the time the next annual planning cycle starts, the territory map a sales team has been working from no longer reflects the market it is supposed to cover.
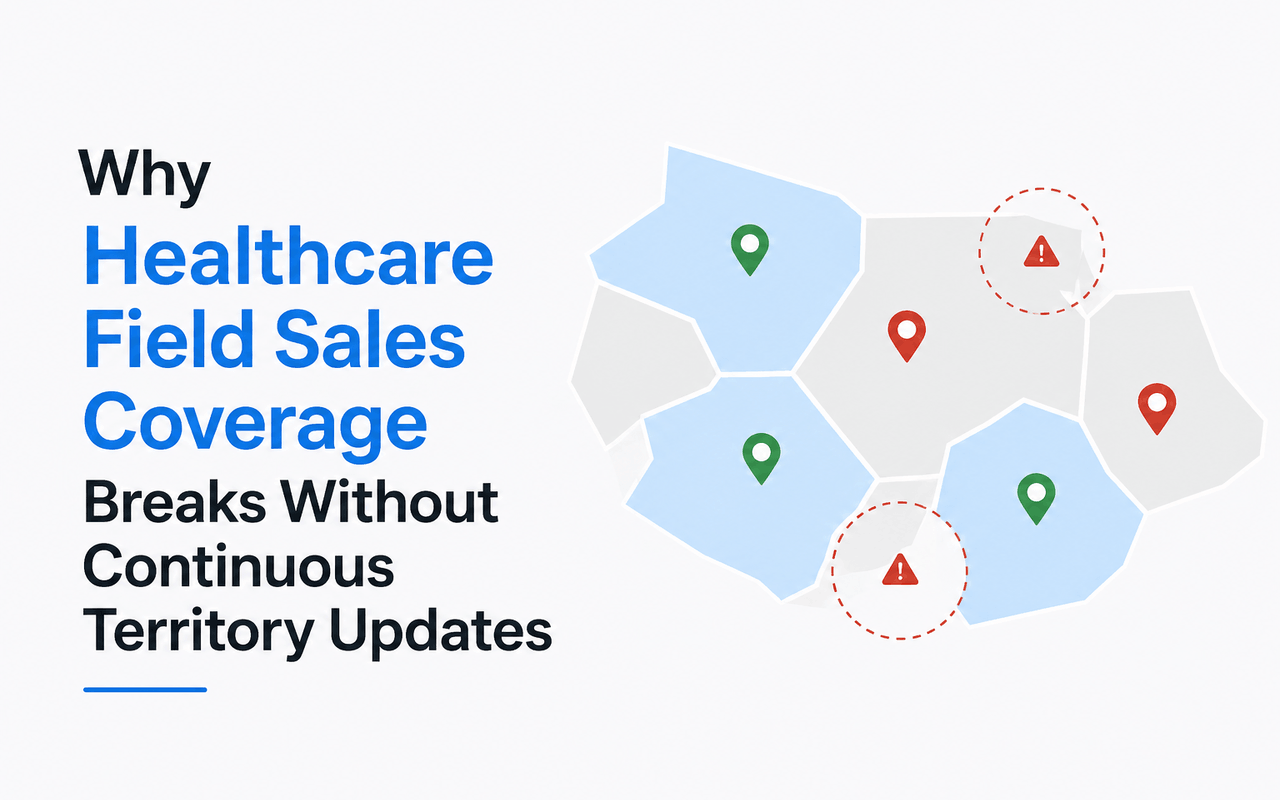
This gap between how fast healthcare changes and how slowly territories adapt has become a structural drag on field sales performance. It shows up as quota misses, missed accounts, overworked reps in some pockets, and underutilized capacity in others.
The fix is not a more elaborate annual realignment. It is continuous healthcare territory optimization, anchored in fresh provider data and built into the rhythm of how the field operates.
The Hidden Problem: Infrequently Updated Territories
Annual realignment as the default cadence has roots in older sales operations practice, where territory design was an expensive, manual, multi-month exercise.
Pharma and medtech inherited this model and largely stuck with it. Industry guidance still suggests companies should realign or re-evaluate their maps and resource allocations every two to three years, if not more frequently, and many organizations interpret “more frequently” as a polite recommendation rather than a hard requirement.
The result is a long lag between when the market changes and when the territory plan reflects it. Industry analysis of life sciences territory design suggests that 20-30% of territories become constrained or outdated when they are not actively maintained.
That is not a marginal problem. It is roughly a quarter of a sales force being asked to operate against a map that does not match the territory under their feet.
But the danger of an outdated territory is that it does not announce itself. Reps continue to call on familiar accounts, the CRM shows activity, and quarterly numbers can hold steady for a while. The deterioration is gradual, a high-volume surgeon leaves a practice but stays in the system, a hospital acquires a multi-site cardiology group and redirects referrals, a procedure shifts to an ASC down the road that was never on the rep’s account list.
Each of these is a small distortion. Compounded across a territory and across a quarter, they translate into a missed pipeline that the team only notices after the gap has widened.
How Healthcare Markets Change Faster Than Territories
Healthcare is not a stable backdrop against which sales activity plays out. The provider landscape is in continuous motion, and three things in particular create the kind of churn that breaks static territory plans.
Provider Movement and Consolidation
Physician turnover and consolidation are the most direct sources of territory disruption. The annual physician turnover rate, as measured by the Annals of Internal Medicine using national Medicare billing data, reached 7.6% by 2018 and has remained at similar levels since.
The 2025 AAPPR Physician and Provider Recruitment Benchmarking Report places the median annual physician turnover rate at 7.3%, with urban areas at 7.8%. At those rates, a sales rep with 200 physicians on their target list can expect roughly 14 to 16 of them to either move or stop practicing in any given year. That alone is enough to put pressure on a static plan.
Consolidation compounds the problem. The U.S. Government Accountability Office reports that at least 47% of physicians were consolidated with hospital systems in 2024, up from less than 30% in 2012.
McKinsey’s analysis of 2024 deal activity similarly found that as many as 70% of physicians are now employed by hospitals or corporate entities, and that more than 80% of physician-led deal activity that year consisted of like-for-like consolidations.
When a physician group changes ownership, downstream changes follow in purchasing committees shift, contracted vendors get re-evaluated, and referral patterns reorganize. None of that is visible in last year’s territory map — referral network mapping from claims data surfaces those shifts as they happen.
Care Site Migration to ASCs
The migration of procedures out of inpatient and hospital outpatient settings into ambulatory surgery centers is the second major source of disruption.
According to Colliers’ Q3 2025 Healthcare Services report, ASC volumes are expected to expand by 9% between 2023 and 2028, and 33% of cardiac procedures are projected to be performed in ASCs by 2025.
For medtech reps, that means high-value cases that used to anchor a hospital account are now distributed across smaller outpatient sites, 92% of which are wholly or partially owned by physicians, with their own decision-making structures.
Deloitte’s 2026 Life Sciences Outlook notes that this shift requires a fundamental recalibration of sales strategies, with ASCs often led by physician-owners or smaller administrative teams as primary decision-makers rather than centralized hospital procurement committees.
A territory designed around the inpatient world a rep covered two years ago will systematically miss the outpatient sites where the procedures actually happen now.
Procedure Volume Volatility
Even when providers and sites stay where they are, procedure volumes do not. Coding changes, new clinical guidelines, payer policy updates, and product launches all shift which physicians are billing for which procedures, and at what rates.
CMS data referenced in published research on provider directory accuracy indicates that roughly 20% of provider information changes every year, covering not just location but also taxonomy, group affiliation, and credentialing.
A separate analysis published through NCBI found that address and specialty information was inconsistent for over 80% of physicians across the directories of five large national health insurers.
If even the payers struggle to keep provider data current, a sales operations team relying on a yearly export is working with information that has decayed substantially before the territory plan goes live.
What “Continuous Coverage” Actually Means
Continuous coverage is often confused with constant rebuilding. It is not the same thing.
Quarterly tear-ups of territory boundaries are themselves disruptive. AlignMix’s pharmaceutical territory design guide notes that pharmaceutical territory changes disrupt prescriber relationships, requiring warm handoffs, compensation protection, and enhanced support as representatives build new relationships, with 60 to 90 day transition periods needed for reps to recover productivity after each shift.
What continuous coverage actually means is keeping the underlying provider, procedure, and account data current, then making targeted adjustments to call plans, account lists, and territory edges as the market moves.
Boundaries can stay where they are. What changes is which providers sit inside them, what those providers are now billing for, and which sites of care a rep should be prioritizing this month.
The trigger for adjustment, as pharma alignment guidance puts it, is when the underlying market changes, whether that is patient demographics, new product launches, persistent underperformance, rep turnover, or shifting payer policies. The calendar is not the trigger.
Why Static Planning Cycles Reduce Performance
The performance cost of static territories shows up in the numbers.
Quota Attainment Suffers
RepVue’s data on medical device sales representatives shows current quota attainment at 57.1% across the role.
A 2026 medical device sales compensation analysis cites a similar figure, noting that only 55% of medical device reps hit quota annually based on RepVue data. At well-known medtech employers, the picture is consistent, ratings show roughly 58% of reps at Medtronic meet or exceed annual quota.
When close to half of the team misses a target in a typical year, the contribution of stale territory data is not theoretical. Reps are calling on accounts that no longer hold the volume they used to, while accounts that have grown into prime opportunities sit outside their list because the underlying data has not been refreshed.
Strategic territory design has measurable productivity implications in the other direction. A pharmaceutical territory design guide reports that companies implementing strategic territory design typically see 18 to 25% improvements in sales force productivity when call frequency and prescriber potential are properly balanced.
Most of that gain is forfeited when the design becomes static.
Coverage Gaps Compound Over Time
Coverage gaps in healthcare territories rarely appear all at once. They accumulate. A new ASC opens, a hospital acquires a cardiology group, three high-volume surgeons relocate from one practice to another across town.
None of those events triggers an automatic update to a territory plan. Over four to six quarters, a rep can lose visibility into a meaningful share of the relevant providers in their geography without any single change being large enough to flag.
Private equity activity adds another layer of churn that legacy planning processes are not built to absorb. The GAO notes that private equity ownership of physician practices reached about 6.5% in 2024, with shares varying considerably by specialty and geographic market, and McKinsey’s 2025 healthcare M&A analysis finds that PE investors continued to focus on physician services, accounting for 30 to 40% of healthcare deals.
Each rollup or platform deal can quietly redraw the buyer landscape inside an existing territory.
Building a More Adaptive Coverage Model
So, essentially, adaptive coverage is an operating model, rather than a tooling decision. Three principles separate teams that get this right from teams that keep losing ground to staleness.
Anchor on Real-Time Provider Data
The starting point is data that updates at a cadence closer to the market’s pace than the planning cycle’s pace. That means provider information, claims-based procedure volumes, hospital and group affiliations, and site-of-care details that refresh on a monthly basis or better.
Annual data exports cannot support continuous coverage because they bake in roughly a year of decay before the plan even goes live.
Use Lightweight Adjustments, Not Full Realignments
Continuous does not mean constant. The aim is small, targeted changes like adding a newly relevant ASC to a rep’s list, reassigning a high-value surgeon who has moved across an existing boundary, adjusting call frequency for accounts whose procedure volumes have spiked or fallen.
These edits do not require redrawing the map and do not trigger the relationship reset that comes with full realignment. Teams that make this work treat their territory design as a stable frame and the activity inside it as the variable.
Build Feedback Loops Between Reps and Sales Ops
Reps are usually the first to notice when a territory has drifted from reality. A surgeon who has stopped taking meetings, an account that has been rerouted to a hospital procurement contract, a new outpatient site that has opened nearby.
Continuous coverage depends on having a low-friction way for those observations to feed back into the data layer that drives planning, rather than getting lost in CRM notes that nobody reviews.
Movemedical’s analysis of medtech rep workflows points out that reps already lose substantial time to administrative friction, with disconnected tools and manual processes leaving support teams without visibility and reps burdened with non-selling activities.
Connecting Coverage Updates to Field Execution
Updating the data and the call plan only matters if those updates show up in how reps actually work the field. Two execution layers determine whether continuous coverage translates into sales results.
Rep Routes Need to Reflect Territory Shifts
When the account list changes, the route logic needs to follow. A rep with a new ASC added to their territory needs the route plan to incorporate it without losing efficiency on the existing accounts.
Driving distance, not zip code adjacency, is the right unit. A surgeon technically inside a territory boundary but a 90-minute drive from the rest of the rep’s day is effectively unreachable, while a high-value account 20 miles outside a zip code line may be a natural fit.
Communicate Changes Without Disrupting Relationships
Account reassignments need warm handoffs. Analysis of pharmaceutical territory transitions notes that productivity dips and prescriber relationships suffer without 60 to 90 day transition periods, prescription credit splits, and intensive support.
The same dynamic holds in medtech and diagnostics, where surgeon and lab director relationships often take longer to rebuild than a quarter. A continuous coverage model that ignores the relational cost of every change will burn out reps and confuse accounts faster than it captures opportunity.
How Alpha Sophia Supports Continuous Territory Optimization
Continuous coverage requires the underlying tooling to support frequent, lightweight adjustments without forcing a full replanning exercise. The Alpha Sophia Territory Manager is built for this. It sits on top of refreshed claims and provider data, and lets sales operations teams maintain territories nationwide as the market shifts, rather than treating each adjustment as a project.
For a deeper walkthrough of the workflow, the Alpha Sophia sales territory planning guide covers the step-by-step setup.
Heat Map Analysis That Reflects the Current Market
Heat map analysis inside the Territory Manager surfaces where opportunity is concentrated across a given geography, layered against the underlying claims and procedure data.
As provider movement and ASC migration shift the distribution, the heat map reflects those changes without a manual rebuild. A sales operations lead can see which ZIP codes have densified or thinned over the last quarter, and which territories now carry imbalanced opportunity.
The view of opportunity size sits alongside the territory design itself, so every adjustment is anchored in the volume it controls, not in habit.
Driving Distance Logic Tied to Real Provider Locations
The Territory Manager calculates driving distance in miles between providers and rep start and end points, rather than relying on geographic adjacency. When continuous coverage adds a new ASC to a rep’s list or shifts a high-volume surgeon to a different account, the route planning and optimization features recalculate around the change, so the rep’s day still adds up.
For a detailed look at how this works, the Alpha Sophia guide to effective territory planning for healthcare reps walks through route structuring and driving distance logic within the Territory Manager.
Set start and end points let coverage planners account for where reps actually live and operate from, not just where the territory looks tidy on a map.
Independent or Overlapping Territory Configurations
Healthcare commercial models rarely fit into clean, non-overlapping territories. A medtech company may run separate teams for capital equipment and disposables across the same hospital footprint and a diagnostics company may layer specialty reps over generalist coverage.
The Territory Manager supports configuring independent or overlapping territories, drawing and redefining boundaries as the model evolves, and editing territory edges as new data comes in. Combined with granular ICD-10 diagnosis data and CPT/HCPCS-level procedure filters, that lets teams adjust who falls inside a given territory based on indication-level fit, not just specialty label.
Conclusion
The annual realignment habit is a holdover from a slower era of healthcare commercialization. Provider consolidation, ASC migration, physician turnover, and routine changes in billing patterns now shift the sales landscape faster than yearly cycles can track.
The teams that maintain coverage are not the ones that redraw maps every quarter. They are the ones that keep their underlying data current, make targeted adjustments inside stable boundaries, and connect those adjustments cleanly to how reps actually work the field.
Continuous territory optimization is about the operating sequence. The teams that get it right are the ones whose data, account lists, and call plans move at the speed of the market they sell into.
FAQs
How often should sales territories be updated?
The boundaries themselves do not need frequent redrawing, but the data inside them should be reviewed at least monthly. Industry guidance recommends a full structural realignment every two to three years, with continuous lightweight adjustments to account lists, call plans, and high-value targets in between.
What is continuous coverage in field sales?
Continuous coverage is the practice of keeping provider data, account lists, and rep call plans current as the market changes, without redrawing territory boundaries each time. The model rests on three things, refreshed claims and provider data, lightweight adjustments inside stable territories, and a feedback loop between reps and sales operations.
How do market changes impact territory performance?
Provider turnover, hospital consolidation, ASC migration, and shifts in procedure volume all distort the assumptions a static territory plan was built on. Over time, reps end up calling on accounts that no longer hold the volume they used to, while newly relevant providers and sites sit outside their list.
What are signs that a territory needs adjustment?
Persistent underperformance against quota in specific accounts, growing drive time without proportional revenue gains, and high-volume providers in the geography who are not on the rep’s list are common signals. Significant local M&A activity, a new ASC opening, or a noticeable change in procedure mix should also trigger a review.
How can teams identify coverage gaps?
The most reliable approach is to compare the rep’s current account list against an up-to-date provider universe filtered by relevant CPT, HCPCS, and ICD-10 codes for the product. Heat map analysis of opportunity density across the geography, combined with rep feedback on accounts that have changed hands or moved sites, surfaces gaps that activity reports alone will miss.
