The Psychiatrist Gap
Mental-health care access varies enormously across the United States. An analysis of psychiatrists and psychologists in the 30 largest U.S. metros reveals a fivefold gap in psychiatrist access — and the metros growing fastest have the fewest.
- 5.2x
- gap between the best metro (Boston) and the worst (Las Vegas)
- 23.9
- psychiatrists per 100k across the 30 metros
- 11%
- of psychiatrists treat children & adolescents
- ~50%
- of psychiatrists in legacy metros are 35+ years past training
36,740 psychiatrists and 84,780 psychologists analyzed · Source: NPI registry data and proprietary insights from the Alpha Sophia healthcare provider database · Media contact: isabel@alphasophia.com
A fivefold gap in psychiatrist access
The national picture. Across the 30 largest U.S. metros, the supply of psychiatrists ranges from 52.7 per 100,000 residents in Boston down to just 10.1 in Las Vegas — a 5.2x difference. The Northeast and established academic-medical hubs (Boston, San Francisco, New York, Baltimore, Philadelphia) sit at the top; fast-growing Sun Belt metros dominate the bottom.
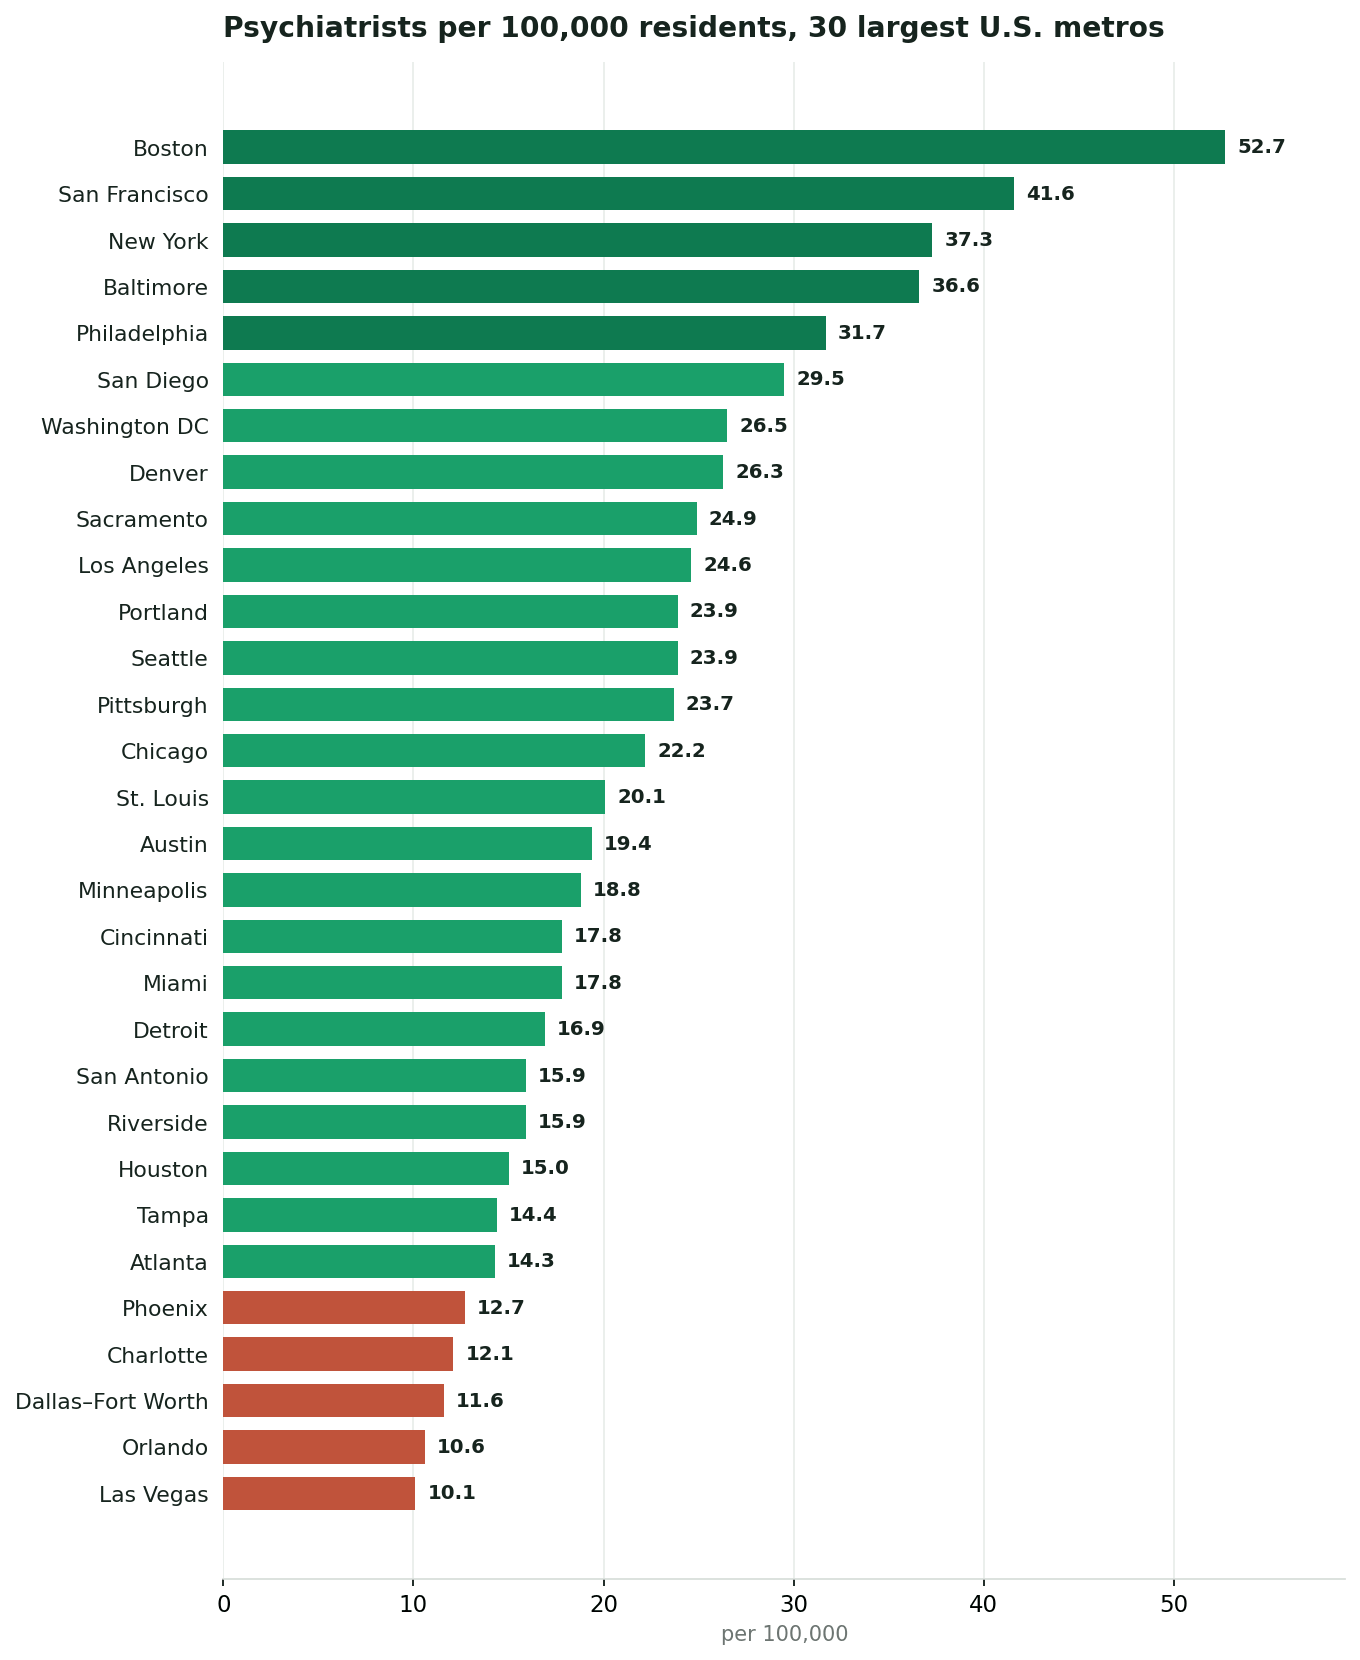
The fastest-growing metros have the fewest psychiatrists
The growth paradox. Among the lowest-supplied metros are some of the nation’s fastest-growing: Las Vegas, Orlando, Dallas–Fort Worth, Charlotte, Phoenix, Atlanta, Tampa and Houston. Populations are surging precisely where psychiatric capacity is thinnest — a widening mismatch between demand and the workforce able to meet it.
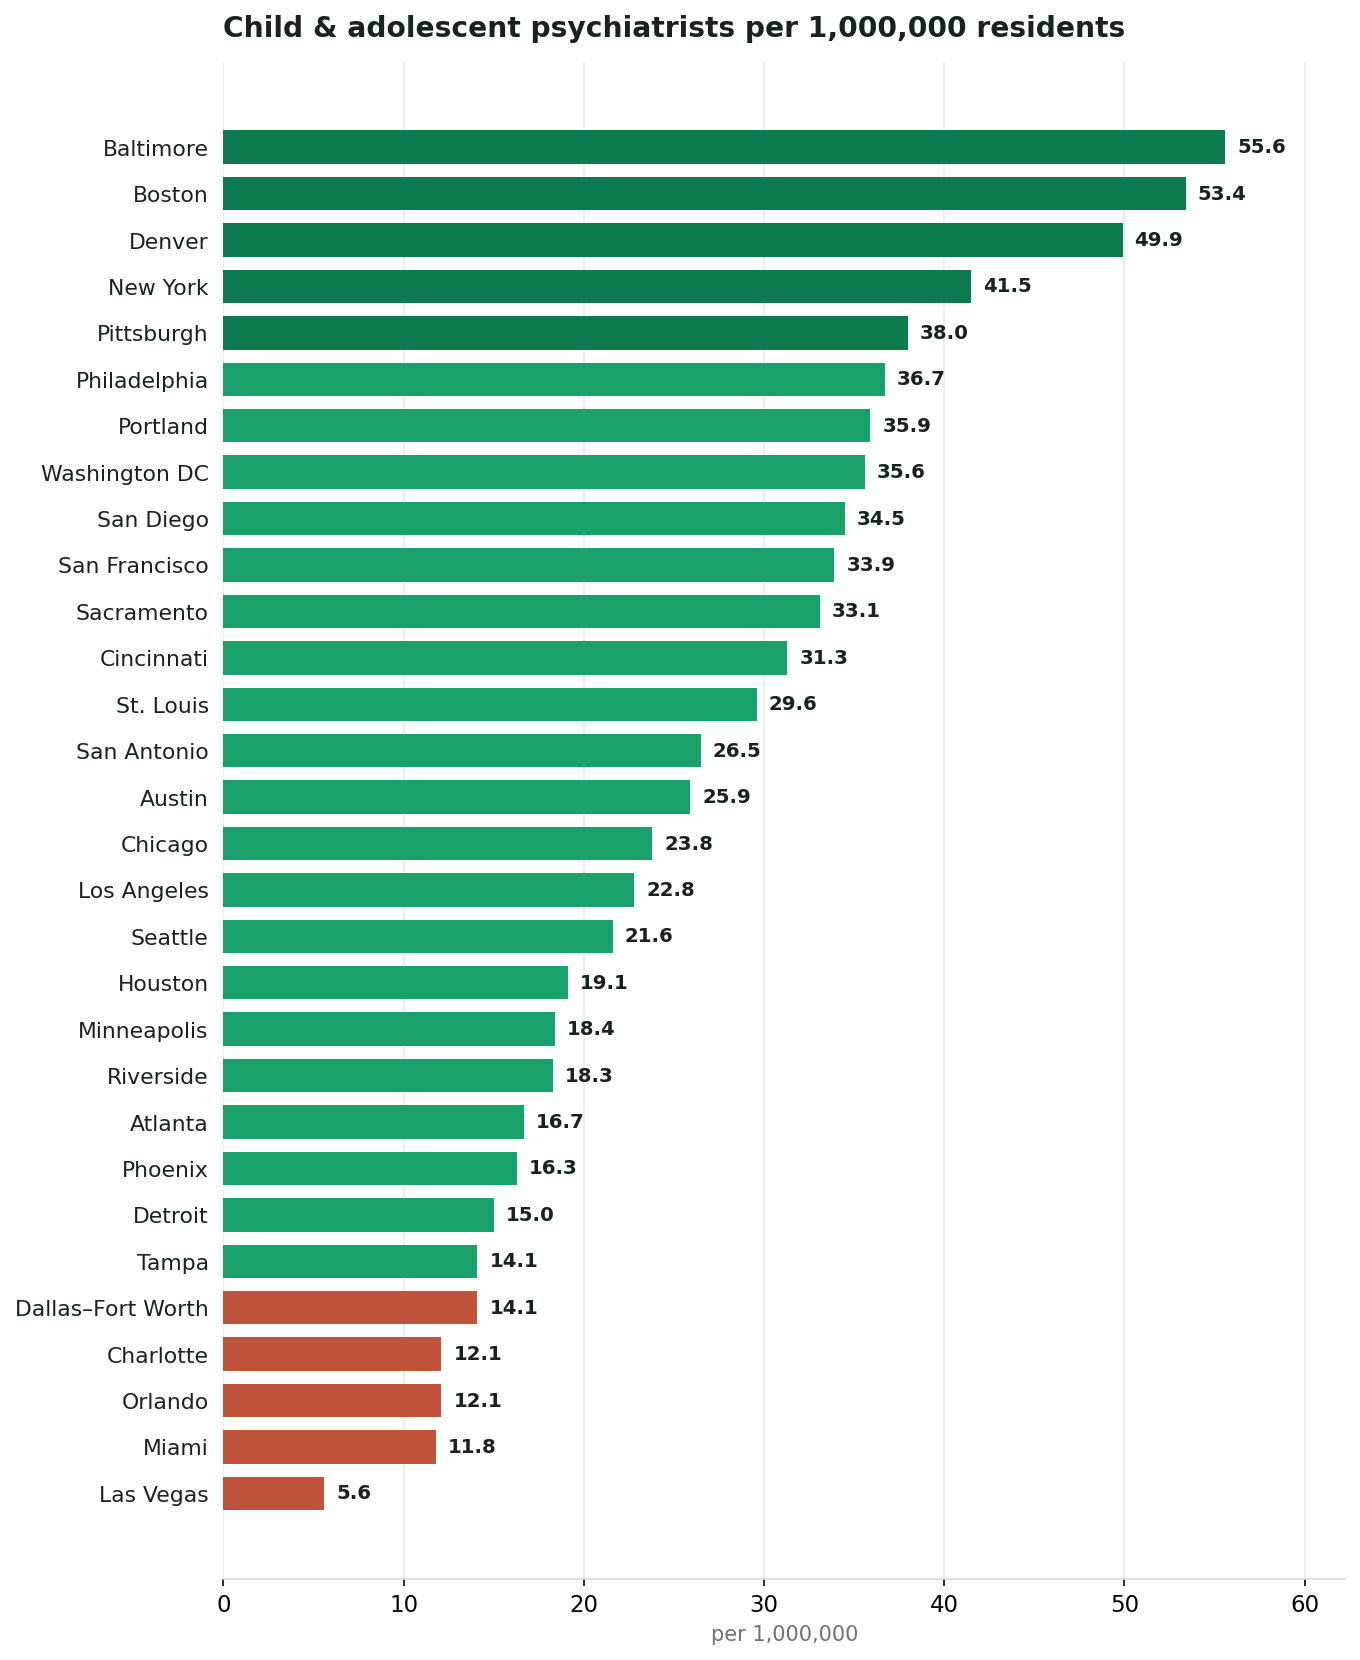
Where kids can’t find a psychiatrist
Children’s care. Child & adolescent psychiatrists make up only about 11% of the psychiatric workforce. Measured per million residents, the gap is even starker than for adults: Las Vegas has just 5.6 per million — 13 child psychiatrists for the entire metro — versus more than 55 per million in Baltimore. Miami, Charlotte and Orlando are also near-deserts for pediatric psychiatric care.
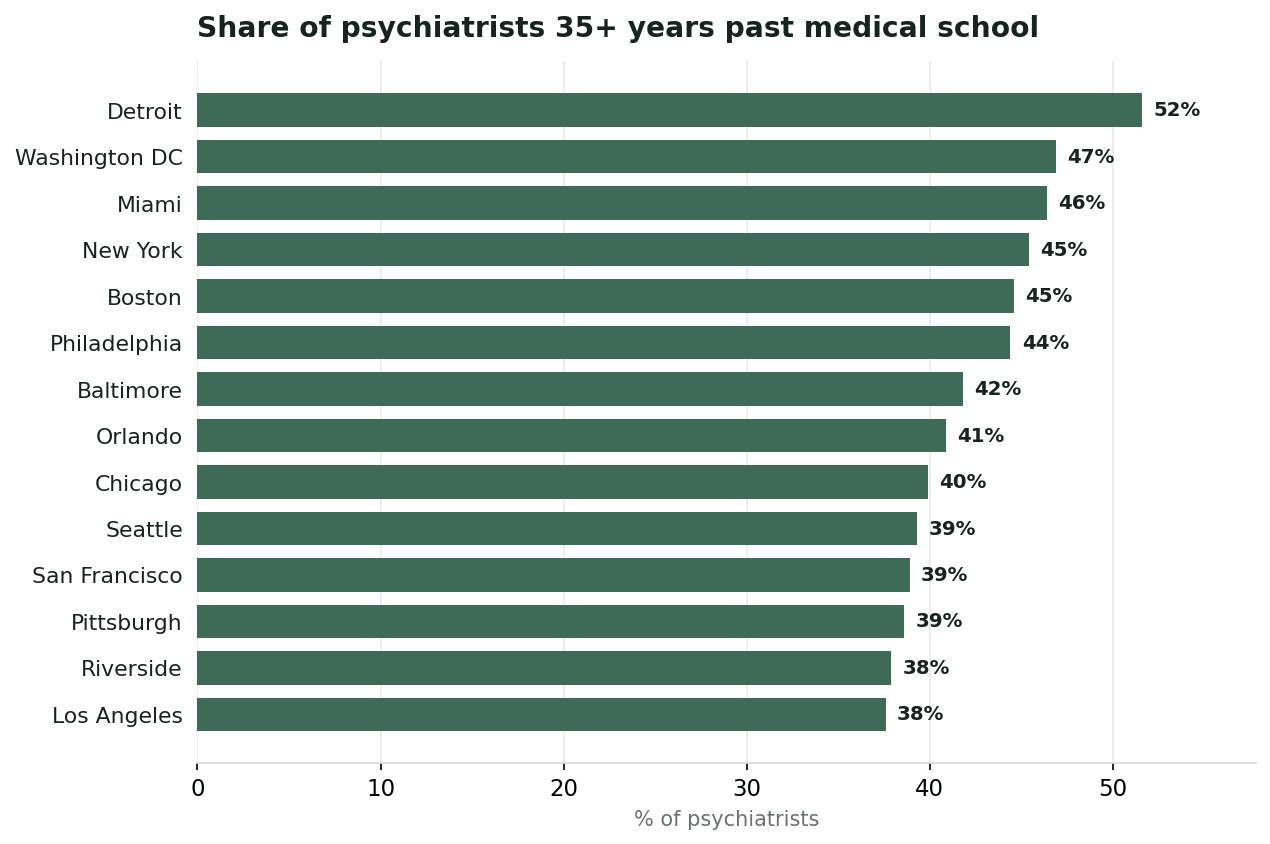
Half the psychiatrists in major metros are nearing the end of their careers
The retirement cliff. In several of the best-supplied metros, a large share of psychiatrists are decades into practice. In Detroit, 52% are 35+ years past medical school; Washington DC, Miami, New York and Boston are all near 45%. The places that look well-supplied today face a wave of retirements that could erode access quickly.
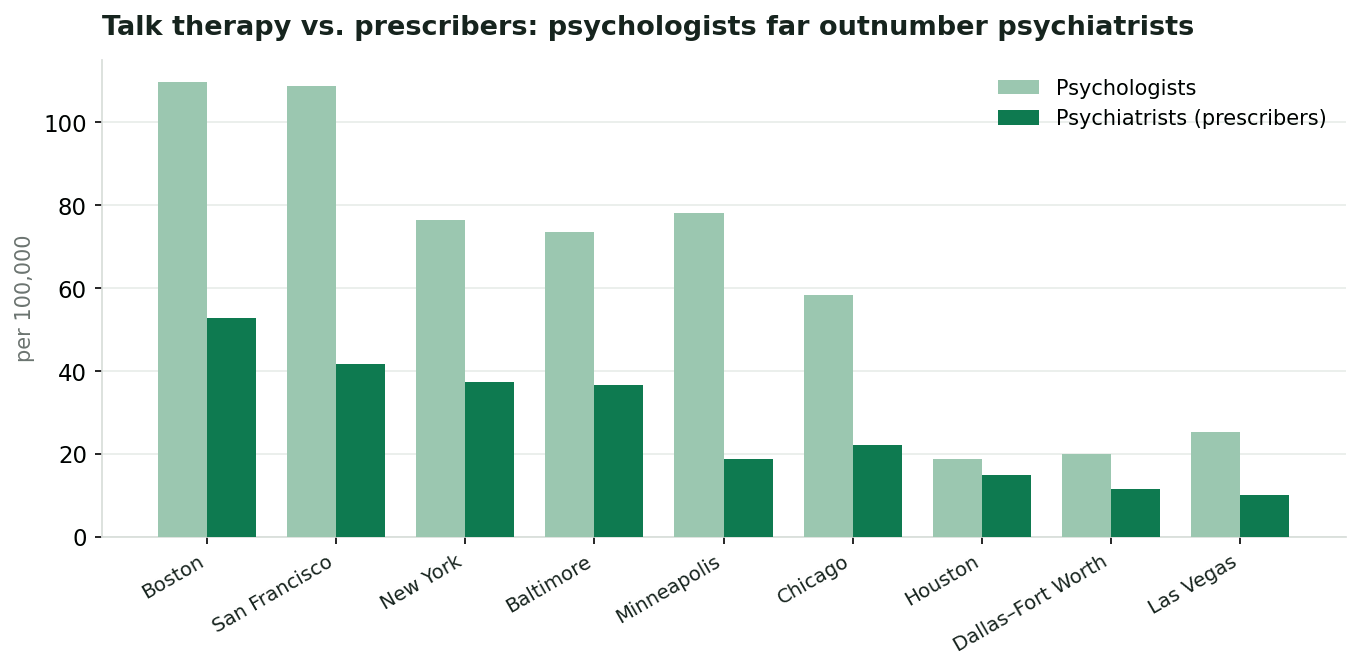
Plenty of therapists, far fewer who can prescribe
The prescriber bottleneck. Psychologists — who provide assessment and talk therapy but generally cannot prescribe medication — outnumber psychiatrists roughly two-to-three to one in most metros. The result is a structural bottleneck: patients can often find a therapist, but face a much thinner supply of clinicians able to prescribe and manage psychiatric medication.
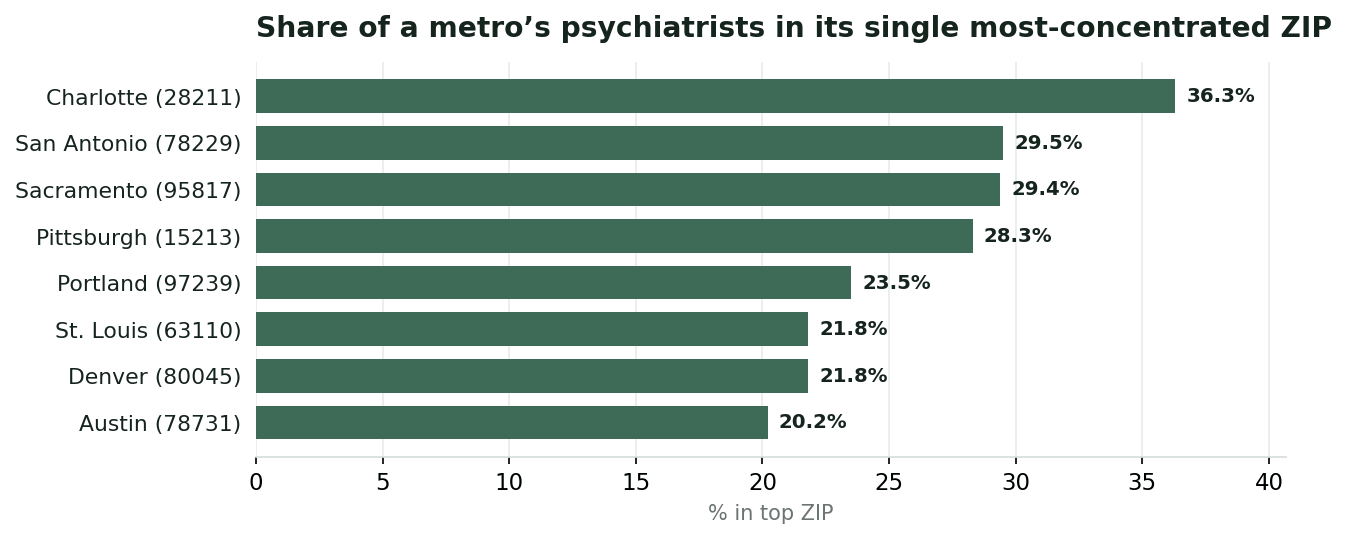
Even where psychiatrists exist, they cluster
Access within metros. Supply is uneven inside metros, too. In several cities a single ZIP code — usually an academic medical center — holds a large share of all the metro’s psychiatrists, leaving outlying neighborhoods underserved even where the metro-wide number looks adequate.
All 30 metros
Full ranking.
| # | Metro | Psychiatrists / 100k | Child psych / million | % 35+ yrs in practice |
|---|---|---|---|---|
| 1 | Boston | 52.7 | 53.4 | 45% |
| 2 | San Francisco | 41.6 | 33.9 | 39% |
| 3 | New York | 37.3 | 41.5 | 45% |
| 4 | Baltimore | 36.6 | 55.6 | 42% |
| 5 | Philadelphia | 31.7 | 36.7 | 44% |
| 6 | San Diego | 29.5 | 34.5 | 36% |
| 7 | Washington DC | 26.5 | 35.6 | 47% |
| 8 | Denver | 26.3 | 49.9 | 36% |
| 9 | Sacramento | 24.9 | 33.1 | 29% |
| 10 | Los Angeles | 24.6 | 22.8 | 38% |
| 11 | Seattle | 23.9 | 21.6 | 39% |
| 12 | Portland | 23.9 | 35.9 | 35% |
| 13 | Pittsburgh | 23.7 | 38.0 | 39% |
| 14 | Chicago | 22.2 | 23.8 | 40% |
| 15 | St. Louis | 20.1 | 29.6 | 36% |
| 16 | Austin | 19.4 | 25.9 | 30% |
| 17 | Minneapolis | 18.8 | 18.4 | 28% |
| 18 | Miami | 17.8 | 11.8 | 46% |
| 19 | Cincinnati | 17.8 | 31.3 | 38% |
| 20 | Detroit | 16.9 | 15.0 | 52% |
| 21 | Riverside | 15.9 | 18.3 | 38% |
| 22 | San Antonio | 15.9 | 26.5 | 36% |
| 23 | Houston | 15.0 | 19.1 | 29% |
| 24 | Tampa | 14.4 | 14.1 | 37% |
| 25 | Atlanta | 14.3 | 16.7 | 37% |
| 26 | Phoenix | 12.7 | 16.3 | 33% |
| 27 | Charlotte | 12.1 | 12.1 | 31% |
| 28 | Dallas–Fort Worth | 11.6 | 14.1 | 36% |
| 29 | Orlando | 10.6 | 12.1 | 41% |
| 30 | Las Vegas | 10.1 | 5.6 | 27% |
Methodology & about
About Alpha Sophia. Alpha Sophia is a healthcare commercial-intelligence platform that maps the U.S. healthcare provider market — physicians and other clinicians nationwide, with profiles spanning specialties, Medicare and commercial procedure billing (CPT/HCPCS) and claims trends, financial relationships, publications and clinical-trial activity, credentials, and practice and contact details.
Methodology. Published June 2026. Source: NPI registry data and proprietary insights from the Alpha Sophia healthcare provider database. Psychiatrists are defined as physicians with a psychiatry taxonomy (general, child & adolescent, geriatric, addiction, forensic and related); psychologists are doctoral/master’s-level providers and are shown separately. Providers are assigned to metros by primary-practice CBSA. Per-capita rates use U.S. Census Bureau July 2024 metropolitan-area population estimates. Cross-metro comparisons are the most robust framing. Media contact: isabel@alphasophia.com.
Have a healthcare question? Call on Alpha Sophia
Alpha Sophia maintains detailed data on virtually every physician and healthcare organization in the United States. Reporters are welcome to use us as a standing resource — for a fast custom analysis, background and context, or an on-the-record source — on almost any healthcare question, in any city or state, at no cost.
Contact Isabel, Founder — isabel@alphasophia.com · alphasophia.com
Suggested citation: Alpha Sophia, "The Psychiatrist Gap," 2026.