How CROs and Pharma Services Teams Use Alpha Sophia for Clinical Trial Site Selection
On this page
The 40% problem nobody budgets for
Ask any clinical operations lead where a study most often goes wrong, and site selection will come up before protocol design, before monitoring, before data management. It is the decision with the longest tail: a site chosen in week six of feasibility is still costing money in month twenty-eight.
The benchmarks have been uncomfortable for a long time. Research from the Tufts Center for the Study of Drug Development has repeatedly found that roughly one in ten activated investigative sites never enrols a single patient, and that a much larger share — historically somewhere between a third and a half — enrol below target. More recent Tufts work benchmarking site activation and enrollment across 2012, 2019, and 2023 shows meaningful improvement in aggregate enrolment achievement, but the variance between sites remains stubbornly wide. Averages got better. Predictability did not.
The financial arithmetic is brutal and well documented. Analysis reported in Applied Clinical Trials modelled a single-patient site at roughly $40,000 in activation cost plus ongoing monthly management — a per-patient cost order-of-magnitude worse than a high-performing site. Multiply that across a 90-site global oncology programme and the waste is not a rounding error. It is a line item large enough to fund a whole additional cohort.
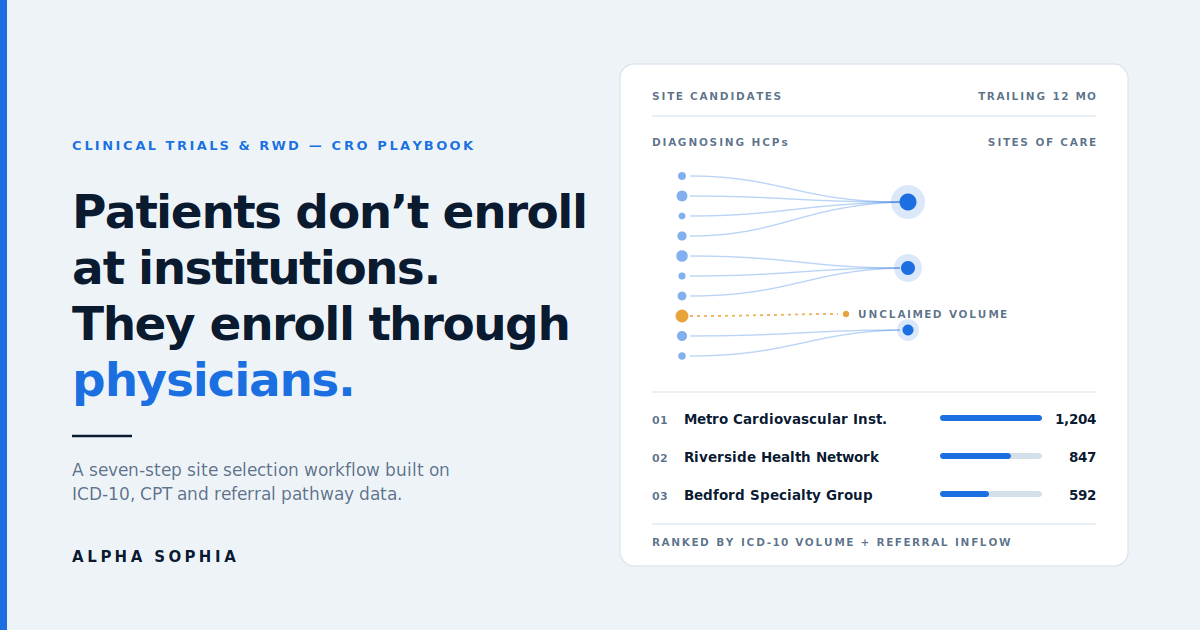
Here is the part that matters for anyone reading this from a CRO or a pharma services organisation: this is not a data availability problem. Sponsors and CROs are drowning in data. It is a resolution problem. Most site selection still happens at the level of the institution — a hospital name, a past-trial track record, a feasibility questionnaire filled in by someone with an incentive to say yes. Patients do not enrol at institutions. They enrol through physicians, and they arrive at those physicians through referral pathways that no feasibility questionnaire has ever captured.
That gap between institution-level selection and physician-level reality is exactly where provider intelligence earns its keep. This post walks through how CROs and pharma services teams actually use Alpha Sophia to close it — not as a theoretical capability list, but as a working sequence you could run next Monday.
If you want the broader vendor landscape first — how RWD platforms, CTMS/eClinical suites, and investigator databases fit together — start with our companion piece, Essential Tools for CROs and Clinical Trial Site Selection. This article assumes you already have that map and want the provider-intelligence layer in depth.
Why “site-centric” thinking under-delivers
Traditional feasibility runs roughly like this. The sponsor supplies the protocol. The CRO queries an internal site database and a historical investigator database, filters for therapeutic area and past performance, sends out feasibility questionnaires, and scores the responses. Sites that have run similar studies before rise to the top.
Four structural weaknesses come with that approach.
It is retrospective by construction. Historical investigator databases tell you what worked in a prior trial, in a prior competitive environment, with a prior patient mix. A cancer centre that enrolled brilliantly for a 2022 study may now be running four competing protocols in the same indication. Past performance is a real signal — it is just not a current one.
It is self-reported. Feasibility questionnaires ask sites to estimate their own eligible patient volume. Sites are staffed by optimists who also want the business. The systematic over-estimation this produces is one of the industry’s open secrets.
It ignores the diagnosing physician. In most indications, the physician who first diagnoses a patient is not the physician at the trial site. A community rheumatologist, a general cardiologist, a primary care physician running the first labs — these people control the top of the funnel and are entirely invisible to site-level feasibility.
It selects for prior participation, which narrows diversity. If you keep choosing the same academic centres, you keep drawing from the same catchment populations. That is a scientific generalisability problem as much as a regulatory one. It also directly conflicts with the direction of travel on representativeness in trial populations, which under FDORA-era policy has been a live regulatory conversation since 2024, even as specific FDA guidance documents have shifted status. Whatever the final form of the guidance, the underlying scientific expectation — that your enrolled population resembles your intended treated population — is not going away.
Provider-level intelligence attacks all four at once, because it starts from a different question. Not “which sites are good?” but “where are the patients actually being diagnosed and treated right now, and who touches them on the way?”
The data layer: what you’re actually querying
Before the workflow, a quick orientation on what sits underneath. Alpha Sophia unifies several public and licensed sources into a single provider and organisation graph covering every NPI-registered HCP in the United States — around 3.9 million providers — plus sites of care, clinical trials, investigators, and publications.
The pieces that matter most for site selection:
- Diagnosis activity (ICD-10). Which physicians are diagnosing and managing your target condition, at what volume, in the trailing period. This is the closest available proxy for a real eligible-patient funnel.
- Procedure and billing activity (CPT / HCPCS Level II). Critical whenever eligibility depends on a procedure, a device, an imaging modality, or a diagnostic test. See our overview of how US healthcare claims data licensing works for how these feeds are sourced and governed.
- Referral pathways. Reconstructed from claims sequencing — which physicians send patients to which specialists and institutions, and in what volume. This is the layer traditional feasibility has no equivalent for. More on the mechanics in Referral Intelligence.
- Trial and investigator history. Which physicians have served as investigators, on what studies, in what phase, and — crucially — what they are running right now.
- Publications and authorship. Research output linked to the individual provider record, which supports both KOL identification and investigator credibility assessment.
- Organisational affiliations and sites of care. Hospital campuses, clinics, ASCs, labs — with the providers who practise at each, so an individual physician signal can be rolled up to an institution.
- Open Payments. Industry financial relationships, which matter for both competitive read-through and conflict screening.
The design principle is that these live on one provider ID rather than in four systems you reconcile in a spreadsheet. We wrote about why that unification is the whole ballgame in How Unified Provider Data Powers Commercial and Research Use Cases.
A seven-step site selection workflow
Step 1 — Translate the protocol into codes
This is the step teams rush and then regret. Your inclusion and exclusion criteria are written in clinical language. Your data is written in ICD-10 and CPT. The quality of everything downstream depends on how faithfully you bridge the two.
Take a protocol for a Phase III heart failure with reduced ejection fraction study. The relevant diagnosis codes cluster under I50 — and the sub-codes matter enormously. I50.20 through I50.23 (systolic heart failure, chronic through acute-on-chronic) will behave very differently in your funnel than I50.30–I50.33 (diastolic). If your protocol requires reduced EF, a query that grabs all of I50 will inflate your addressable population by a factor that will embarrass you in month four.
Layer in the procedure signal. If the protocol requires a recent echocardiogram, add the relevant echocardiography CPT codes. If it excludes patients with a recent implantable device procedure, you can identify — and de-prioritise — physicians whose panels skew heavily toward device management.
Do the same for exclusions. A frequent, under-used move: build a negative code set for common exclusion criteria (advanced CKD, recent MI, active malignancy) and use it to discount physician panels that will convert poorly even at high headline volume.
Our deep dive on this specific step, with worked examples across several therapeutic areas, is How to Use ICD-10 Data for Clinical Trial Site Selection. If you take one thing from it: build the code set collaboratively with the medical monitor, not in isolation on the ops side.
Step 2 — Size the market before you size the site list
Before naming a single site, answer the question the sponsor will ask in the kickoff call: how many eligible patients exist, and where?
Run the code set nationally and aggregate. You get a defensible top-line estimate of diagnosed patient volume, broken out by state, metro, and organisation. This is your feasibility floor — the number no site strategy can exceed.
Then look at the distribution, because that shape drives your whole design. Two indications with identical national volumes can demand opposite strategies:
- Concentrated. A rare oncology indication where 60% of diagnosed volume sits in 30 academic centres. Strategy: fewer, deeper sites; expect competitive saturation; budget for it.
- Dispersed. A cardiometabolic indication spread thinly across thousands of community practices. Strategy: many sites, or a hub-and-spoke design where community diagnosers refer into a smaller number of activated sites.
A CRO that presents this distribution analysis in a bid defence is doing something most competitors are not. It converts “we will find you sites” into “here is the shape of your patient population, and here is the site architecture that shape requires.”
Step 3 — Rank the physicians, not just the institutions
Now go down a level. Filter to physicians with meaningful trailing-period volume against your code set, in the relevant specialties, in your target geographies.
The output is a ranked physician list with, for each: diagnosis volume against your specific codes, relevant procedure volume, practice setting, organisational affiliation, and site of care.
Two patterns show up almost every time and both are commercially valuable to a CRO:
High-volume physicians at institutions nobody has on the site list. Community practices and regional health systems that manage large panels but have never been approached because they lack a trial track record. These are your naive-site opportunities — no competing protocols, motivated staff, and often a more demographically representative catchment. They need more site-support investment, which is a service line most CROs are happy to sell.
Known trial institutions where the actual volume sits in a different department than you assumed. The famous name is real, but the patients are being managed three floors down by physicians who are not on anyone’s investigator list.
Step 4 — Map the referral pathways
This is the step that separates provider intelligence from a better physician directory.
Take your ranked list of diagnosing physicians and trace where their patients go. Referral intelligence reconstructs, from claims sequencing, which providers send patients onward and to whom.
In practice you are looking for three things:
- Feeder physicians for a candidate site. If Site A is a strong candidate, which community physicians already refer into it? Those physicians are your pre-existing recruitment funnel. Site A’s realistic enrolment ceiling is a function of that inflow, not of its bed count.
- Orphaned volume. High-diagnosis physicians whose referral patterns do not lead to any candidate site. This is unclaimed enrolment potential and often the strongest argument for adding a site in a geography your initial map skipped.
- Hub identification. In dispersed indications, the institution with the highest referral inflow frequently outperforms the institution with the highest internal patient volume. Inflow is a leading indicator; internal volume is a lagging one.
The practical output is a site strategy with two tiers: activated sites, and a named, evidence-based list of referring physicians for each — which the sponsor’s field medical team or the CRO’s own site-support function can engage as a recruitment programme rather than a hope.
Step 5 — Assess investigator credibility and competitive load
For each candidate site, evaluate the physicians who would actually serve as PI or sub-I:
- Trial history. Prior investigator roles, phases, indications, sponsor types.
- Current trial load. The most under-weighted variable in site selection. A PI running three competing protocols in your indication is a liability regardless of pedigree — you will be fourth in line for every eligible patient who walks through the door.
- Publication record. Not raw count. As we argued in Why Publication Volume Alone Doesn’t Predict Clinical Influence, volume and influence diverge constantly. Look at recency, authorship position, and whether the work is in your indication.
- Open Payments relationships. Useful in two directions: gauging how deeply engaged a competitor already is with a given investigator, and screening for conflicts before the sponsor’s compliance team does it for you.
- Emerging investigators. High clinical volume, growing publication record, limited prior trial participation. Under-recruited, motivated, and frequently excellent. Our piece on spotting rising stars covers the identification pattern.
Step 6 — Pressure-test representativeness
Once you have a draft site list, check it against the intended treated population before it goes to the sponsor.
Because sites of care carry geographic and organisational context, you can review the catchment profile of your proposed network in aggregate and identify where it skews — and, more usefully, identify specific high-volume physicians in under-covered geographies who would rebalance it.
The important framing for a CRO: this is far cheaper to fix in feasibility than in month nine, when a sponsor’s enrolment review flags that the study population does not resemble the treated population. Surfacing it proactively in a bid is a genuine differentiator.
Step 7 — Push the output into your operational systems
A ranked site list in a PDF dies in a shared drive. The workflow only compounds if the output lands in the systems your teams actually work in.
Three routes:
- Export. Structured exports with NPI, organisation, site of care, and the underlying volume metrics, ready for your CTMS or feasibility tracker.
- API. The Alpha Sophia Provider API lets you embed provider queries directly into internal feasibility tooling — so site scoring becomes a service your platform calls, not a report someone runs.
- CRM. Native HubSpot integration and standard export paths for other CRMs, so business development and site relationship management work from the same records as feasibility.
If you are reconciling investigator lists against NPI numbers from legacy spreadsheets — and most organisations are — bulk NPI lookup is usually the first hour of work. We covered the broader architecture argument in What Changes When Healthcare Data Becomes Truly System-Ready and in The Case for Embedding HCP Intelligence Directly into Your Tech Stack.
Worked example: a Phase III non-alcoholic steatohepatitis programme
Consider a mid-sized CRO bidding on a Phase III NASH/MASH study. Target: 400 patients, 60 US sites, 14-month enrolment window.
The conventional bid. Query the internal database for hepatology sites with prior NASH experience. Roughly 80 US sites have run comparable studies. Send questionnaires, score responses, propose 60. The problem is obvious in the room: every competing bidder is proposing substantially the same 60 sites, and those sites are already carrying multiple competing protocols in an unusually crowded indication.
The provider-intelligence bid.
Codes. K75.81 for NASH, plus adjacent K76.0 for fatty liver, plus fibrosis-staging procedure codes — elastography, relevant biopsy codes — to isolate physicians actively staging rather than merely coding a diagnosis. That procedure filter is the single highest-value move in the whole exercise: it separates physicians managing a real workup pathway from those recording an incidental finding.
Sizing. National diagnosed volume against the code set, distributed by metro. The distribution turns out to be far more dispersed than the 80-site academic hepatology map implies — because a large share of these patients are managed by gastroenterologists and endocrinologists, not hepatologists.
Physician ranking. Roughly 2,000 physicians with meaningful trailing-year volume and active staging activity. A material share are in community GI and endocrinology practices with no trial history at all.
Referral mapping. Trace where those community physicians’ patients go. Several regional health systems emerge with high referral inflow but no NASH trial history — invisible to a track-record-based search, and structurally well positioned.
Investigator assessment. Screen candidate PIs at both academic and community sites for current competing trial load. Several marquee hepatology names are carrying three or more competing protocols. Several community gastroenterologists have relevant publication records and zero competing load.
The proposal. A 60-site network: 25 established hepatology sites (fewer than competitors are proposing, chosen for low competitive load rather than name recognition), 25 community GI and endocrinology sites with high staging volume and no competing protocols, and 10 regional health systems selected on referral inflow. Each community site arrives with a named list of referring physicians. Catchment profile checked and rebalanced against the intended treated population.
The second bid is not just better strategy. It is a fundamentally different sales posture — you are bringing the sponsor a quantified population map, not a list of names they could have assembled themselves.
Where this fits alongside your existing stack
To be direct about scope: provider intelligence is a layer, not a replacement for your eClinical infrastructure.
- Patient cohort platforms — TriNetX, IQVIA — model EHR-based eligibility against complex criteria. Strongest when inclusion depends on labs, vitals, or unstructured clinical detail.
- Historical investigator databases — Citeline — validate track record and operational readiness. Retrospective by nature, and complementary.
- eClinical and CTMS platforms — Medidata and peers — run the study once sites are chosen.
- Public registries — ClinicalTrials.gov for competitive landscape; the NPPES NPI Registry and CMS data as public foundations.
- Provider intelligence — where Alpha Sophia sits: physician-level diagnosis and procedure activity, referral pathways, investigator and publication signals, unified on one record.
The layers answer different questions. Cohort platforms tell you whether eligible patients exist. Provider intelligence tells you which physicians control access to them and how they flow. If you are comparing directly, we maintain side-by-side breakdowns including Alpha Sophia vs IQVIA, vs Definitive Healthcare, vs H1, and vs Clarivate.
Metrics worth tracking
If you adopt this workflow, instrument it. The case for provider intelligence is empirical, and you should be able to prove or disprove it internally within two studies.
| Metric | Why it matters |
|---|---|
| Non-enrolling site rate | The headline. Benchmark your own baseline before you change anything. |
| Enrolment achievement variance | Averages hide the problem; spread is where the money leaks. |
| First-patient-in cycle time | Better-matched sites tend to activate and enrol faster. |
| Screen failure rate | High failure usually means your code translation was too loose — a Step 1 diagnostic. |
| Referral-sourced enrolment share | Directly measures whether Step 4 is earning its keep. |
| Naive-site performance vs. experienced-site performance | Tests the core hypothesis that current volume beats past track record. |
| Catchment representativeness vs. intended population | Cheaper to manage prospectively than to remediate. |
The one to watch hardest is screen failure rate. If it rises after you adopt volume-based selection, your ICD-10 and CPT translation is too permissive — go back to Step 1 with the medical monitor rather than abandoning the approach.
Frequently asked questions
How is Alpha Sophia different from a patient cohort platform like TriNetX? They answer different questions and are frequently used together. Cohort platforms query EHR networks to estimate how many patients meet detailed clinical criteria, including labs and unstructured notes. Alpha Sophia works at the provider level across the full universe of NPI-registered US HCPs — showing which physicians are diagnosing and treating your population, how patients flow between them via referral pathways, and which physicians have investigator or publication credibility. Cohort platforms are strongest for eligibility modelling; provider intelligence is strongest for identifying and prioritising the physicians and sites that control access.
Can I use this for non-US trials? Alpha Sophia’s coverage is the United States. For global programmes, teams typically use it for the US portion of the site network — often the largest and most competitively saturated segment — and pair it with regional data sources elsewhere.
How current is the underlying claims and diagnosis data? Claims data carries an inherent lag between service and adjudication, so volumes reflect a trailing period rather than this morning. For site selection this is rarely a constraint: enrolment potential is a function of sustained patient flow, not last week’s activity. What matters is that trailing-period claims are dramatically more current than historical trial databases, which may reflect studies run several years ago. Our claims data licensing overview covers sourcing and refresh in detail.
Does this replace feasibility questionnaires? No — it changes what they’re for. Instead of asking sites to estimate their eligible population (which they systematically over-estimate), you arrive with an independent volume estimate and use the questionnaire for what only the site can tell you: staffing, competing protocol commitments, IRB timelines, equipment, and genuine interest. You spend fewer questionnaires on better-qualified candidates.
How do I handle sites with no prior trial experience? Treat naive-site capacity as a service design question rather than a disqualifier. High-volume, trial-naive practices typically need more startup support — training, regulatory assistance, sometimes embedded coordinators — but they bring no competing protocol load and often better representativeness. Many CROs have built a distinct service line around this, and it is a differentiator in bid defence. Screen for site-level infrastructure signals and be honest with the sponsor about the support investment required.
What does the referral pathway data actually show? It reconstructs, from sequenced claims activity, which providers send patients to which other providers and institutions, and at what volume. For site selection this reveals a candidate site’s real patient inflow, identifies the specific community physicians feeding it, and surfaces high-volume diagnosers whose patients are not currently flowing to any of your candidate sites. See Referral Intelligence for the methodology.
Can this be automated into our internal feasibility tooling? Yes. The Provider API exposes the same filters programmatically, so a CRO can build protocol-to-code-set-to-site-list as an internal service. Several organisations run an initial automated pass at bid stage, then apply human review to the shortlist.
How does this support representativeness requirements? By making the composition of your proposed site network visible before it is finalised. Because sites carry geographic and organisational context, you can review the aggregate catchment profile of a draft network and identify specific high-volume physicians in under-covered areas who would rebalance it. It does not write your enrolment plan, but it converts representativeness from a post-hoc reporting exercise into a design input.
We’re a pharma services organisation, not a CRO. Does this apply? Directly. Site identification and patient recruitment vendors use the same workflow to build recruitment site networks. Site management organisations use it to evaluate acquisition targets and identify affiliation opportunities. Medical communications and field medical teams use the investigator and publication layers for KOL work — see From Publications to Practice. The underlying asset is the same provider graph; what changes is which slice you query.
What’s the fastest way to test this on a live protocol? Run it retrospectively against a study you have already completed. Build the code set from the real protocol, generate the site ranking as if you were at feasibility, and compare it against actual enrolment performance. It takes a few hours and gives you a defensible internal answer rather than a vendor claim.
Closing
Site selection has been treated as a relationship business wearing a data costume for a long time. The site list comes from who you know; the data arrives afterwards to justify it.
The organisations pulling ahead have inverted that. They start from where patients are actually being diagnosed and treated, trace how those patients move through the system, evaluate investigators on current load rather than reputation, and only then apply relationships — as an execution advantage rather than a selection criterion.
For a CRO or pharma services organisation, this is not only an operational improvement. It is a commercial one. When you walk into a bid defence with a quantified population map, a referral-backed site architecture, and a representativeness analysis nobody asked for, you are no longer competing on price and headcount.
Want to see this workflow on one of your own protocols? Book a demo and we’ll build a site ranking against your code set.
Related reading: How to Use ICD-10 Data for Clinical Trial Site Selection · Essential Tools for CROs and Clinical Trial Site Selection · How Unified Provider Data Powers Commercial and Research Use Cases · How Pharma Teams Use Real-World Evidence to Improve Launch Strategy · Why Publication Volume Alone Doesn’t Predict Clinical Influence
